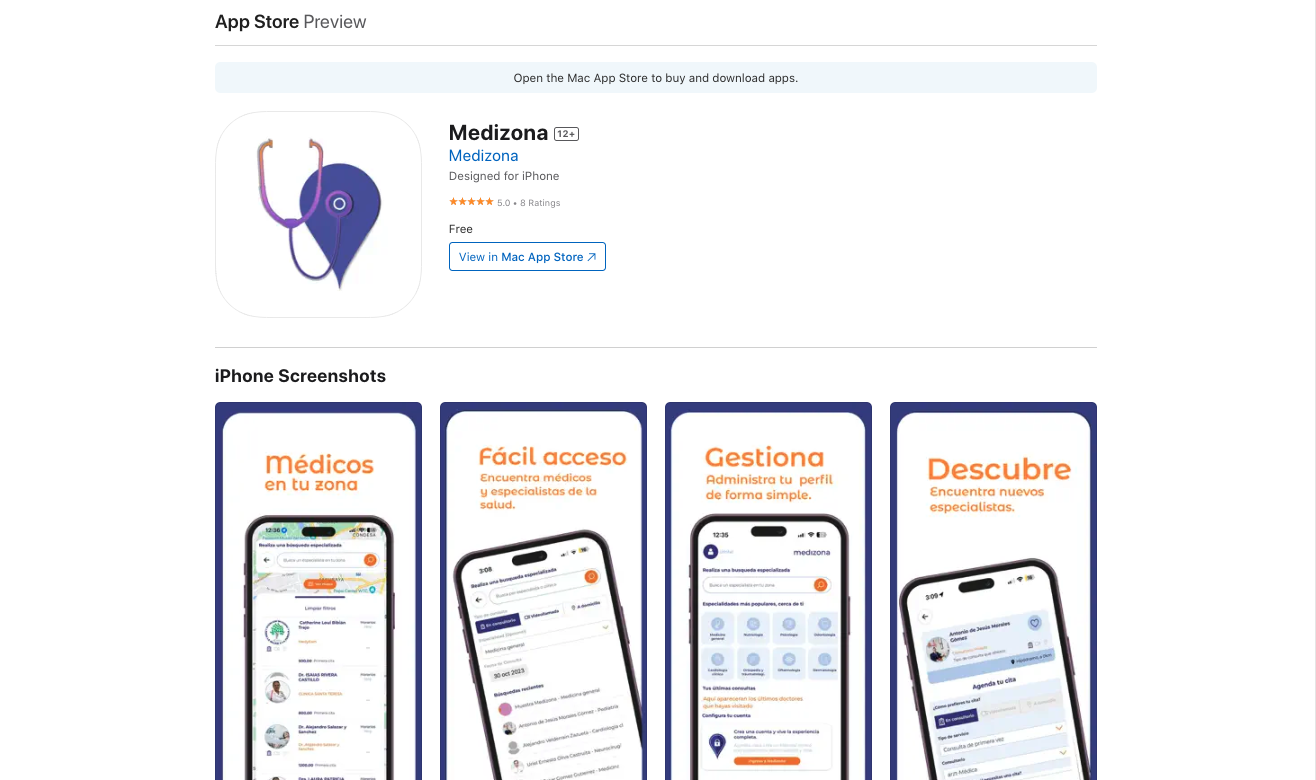
Medizona
Internal data visualization services for environmental consultancy services and intelligent data analysis.
Stack
React Native
TypeScript
Expo

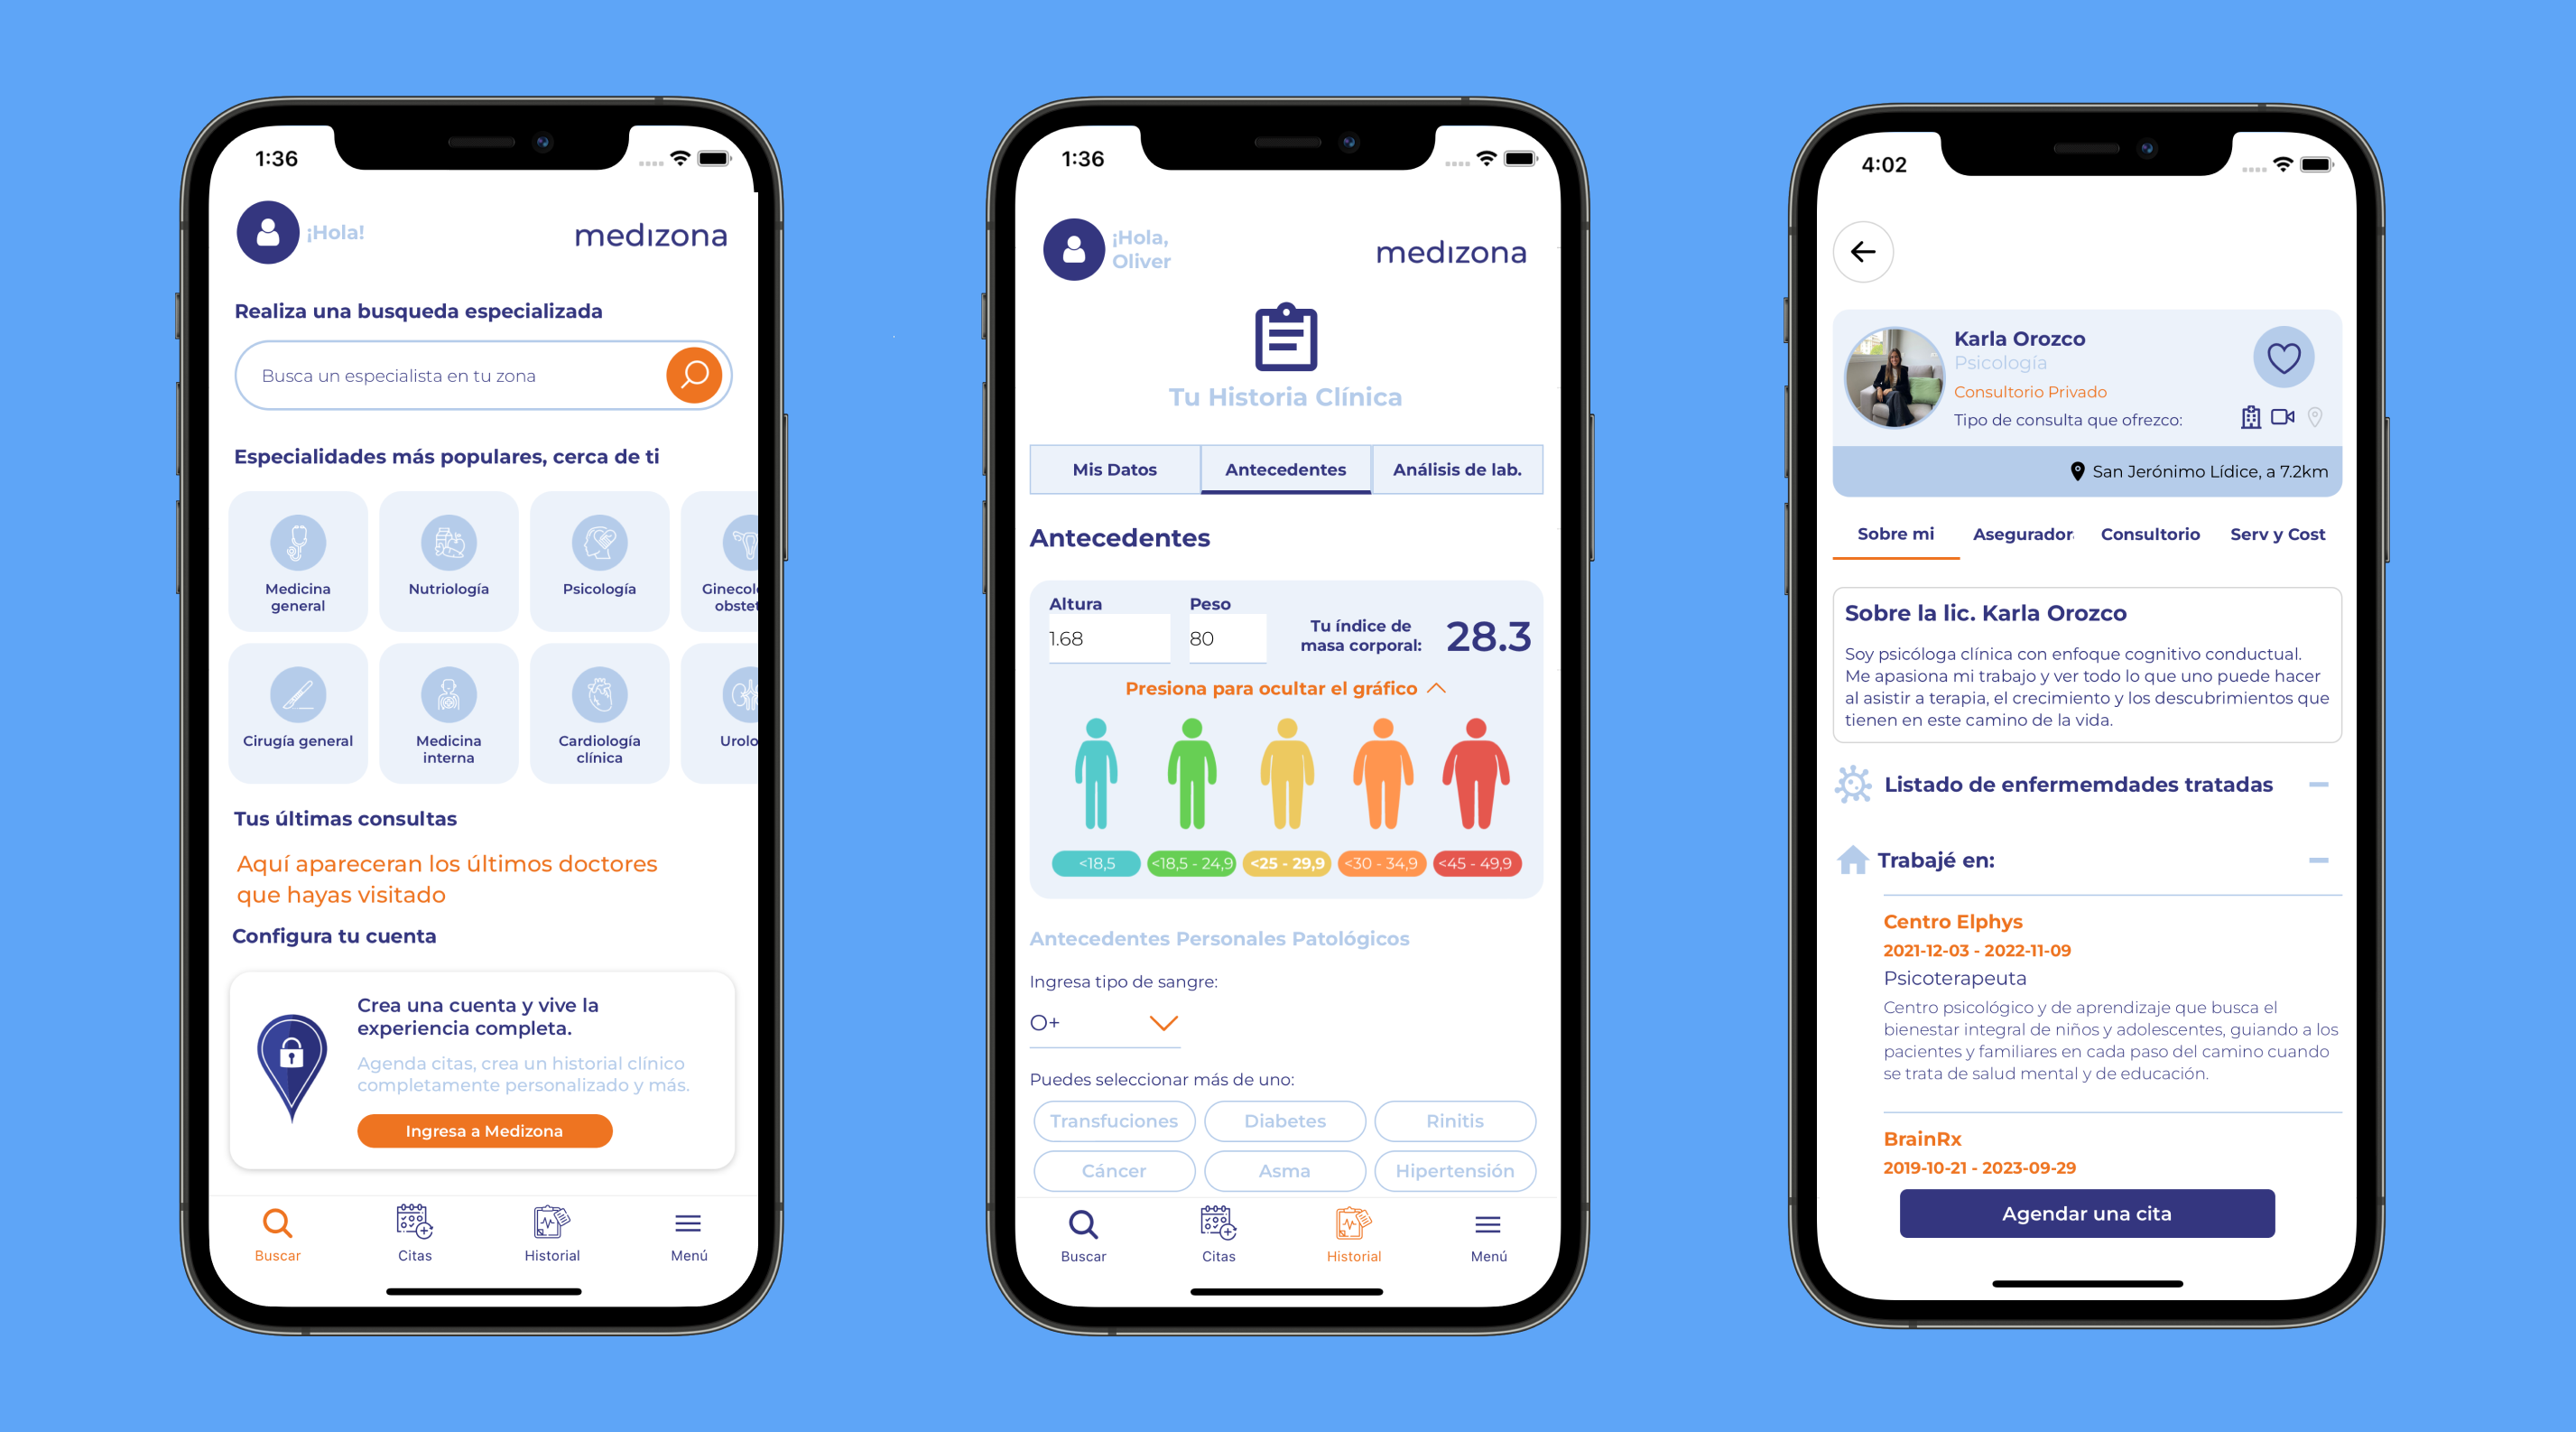
Project purpose
Develop internal tools for visualization of data collected from different private and governmental projects and integrate the different databases and spreadsheets into a single administrative manager based on web technologies.
Stack explanation
I choose React for this project to build the SPA and web app features around authentication, Chart.js for data visualization, Redux as the global state manager. Everything was handled through JavaScript native fetch for the API communication (and the Airtable based spreadsheets).


Solved problems
Build different chart representations, build interactive data state handlers and improve the render perfomance for real time interactivity and handling states for every registered project as well as optimize the Airtable API implementation for faster synchronization and data udpdates.
Conclusion
I learned a lot of data reading and handling and represent this chunks of data into real time interactive charts that actually describes every analysis from the projects and integrated data from different endpoints. I understand the importance of API architecture from an in-house implementation to third party services and optimize asynchronous calls natively.